A Star Team is an awesome team that is extremely effective in fulfilling its purpose. But what how can you assess the skills in your team? In a previous article we described the Star Team Skills, now we will explore how to actually measure the Star Team Skills.
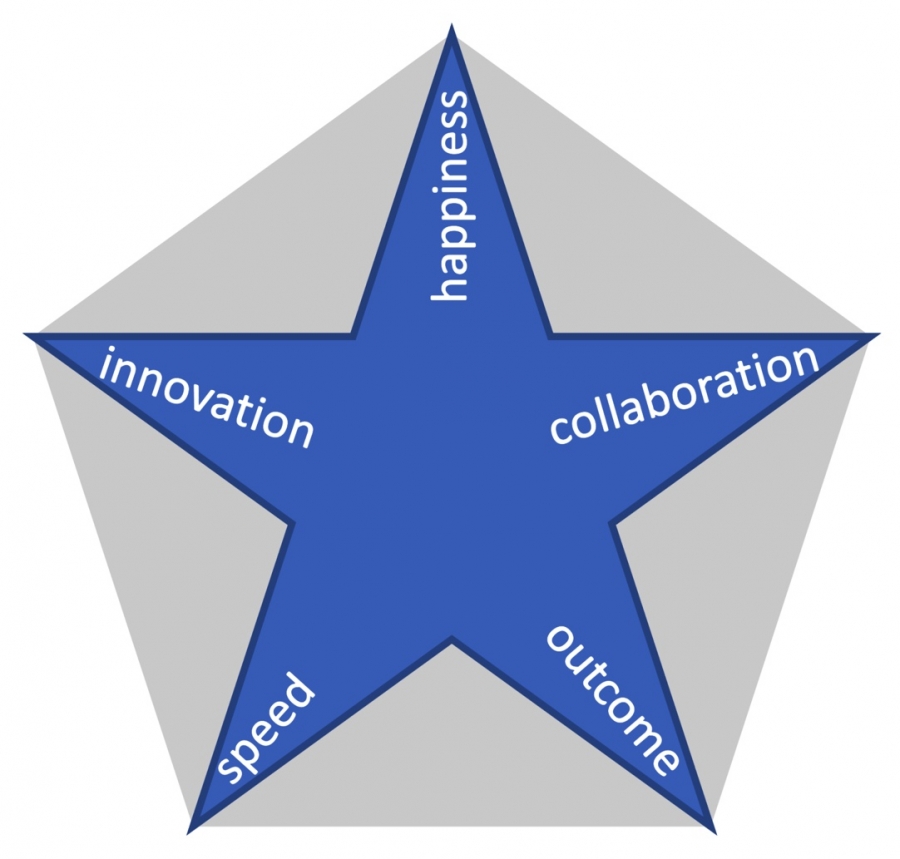
A team needs five skills to become a Star Team, these are Speed, Outcome, Collaboration, Happiness and Innovation. If we dive into the single Star Team Skills we can find metrics that relate to them and that can help us evaluate the awesomeness of a team.
The DevOps Research & Assessment (DORA) program, acquired by Google in 2018, annually publishes a "State of DevOps Report" based on surveys of over 32.000 professionals worldwide. Nicole Forsgren, Jez Humble and Gene Kim also wrote a book called Accelerate, where they dive deep into the survey results and describe the key DORA Metrics Change Lead Time, Deployment Frequency, Mean Time to Resolution and Change Failure Rate. Later DORA added a fifth metric, Reliability, to the key metrics for DevOps teams. These five metrics have turned onto a kind of state-of-art set of metrics for DevOps teams. These metrics cover the most essential metrics for DevOps teams with focus on speed and outcomes, but according to our experience they do not cover the full spectrum of Team Skills required for a development team to become awesome. The DORA metrics are also explicitly highlighted below.
The metrics below are examples of leading/lagging, qualitative/quantitative and objective/subjective metrics.
Speed
The speed skill is mainly about how fast the team can deliver their output and can be further drilled down into the following five categories:
| Speed Category | Example Metrics |
| Predictability | Roadmap Completion, Sprint Success Rate, Velocity Variability, Committed/Delivered Ratio |
| Throughput | Lead Time (DORA), Cycle Time, Ticket Size, Release Effort |
| Frequency | Commits Rate, Pull Requests Rate, Deployment Rate (DORA), Release Rate |
| Technical Complexity | Technical Debt, Coupling, Code Complexity, Pull Request Size, Mean Time To Repair (DORA) |
| Process Waste | Work-In-Progress, Waiting Time, Manual Work, CI/CD Feedback Time, Handovers, Interruptions |
Outcome
The outcome of describes the value of the team output and can be split up into three categories.
| Outcome Category | Example Metrics |
| Customer Satisfaction | Net Promoter Score, Stakeholder Promoter Score, Feature Adoption, Usability, A/B Tests Count |
| Quality | Change Failure Rate (DORA), Defect Rate, Defect Density, MTBF, CI/CD Failure Ratio, Incidents, Vulnerabilities, Code Coverage, Pull Request Improvements, Sustainable Architecture |
| Product Performance | Uptime, Availability, Latency, Performance, Scalability, Reliability (DORA) |
Collaboration
The Collaboration defines how effective the team collaborates and can be described in five categories:
| Collaboration Category | Example Metrics |
| Responsibility Distribution | Pull Request Review Distribution, Contributors / Module, Reviewers / Module, Shared Ownership |
| Collaboration | Pair/Mob Programming Time, Whiteboard Sessions, Spent Time Together, Pull Request Wait Time, Onboarding Time, Development Environment Setup Time, Work In Progress, Documentation |
| Shared Values, Goals & Processes | Involvement in Discussions, Planning Time |
| Commitment | Internal Commitment, Focus Time, Sprint Success Rate, Problem Solution Time |
| Autonomy | External Dependencies |
Happiness
The happiness and psychological safety in the team is fundamental to an awesome team and can be described in four categories:
| Happiness Category | Example Metrics |
| Psychological Safety | Trust, Employee NPS |
| Challenge Level | Having Impact, Making Progress, Appropriate Competence, Stress Level, Burnout |
| Personal Development | Career Path Transparency, Utilised Training Budget |
| Leadership | Feedback Quality/Frequency, Salary + Perks, 1:1 Frequency/Quality, Caring Boss, Availability of Suitable Resources and Tools |
Innovation
Innovation describes how good the team learns and innovates and can be described through four categories:
| Innovation Category | Example Metrics |
| Continuous Improvements | Retrospective Frequency, Time Until Problem Solved, Waste Exploration Frequency, Customer Interviews, Number Optimized Feedback Loops |
| Experimentation | Hackday Participation, Timeboxed Spike Frequency, Try-New-Tech-Days, Documented Experiments, New Product Ideas |
| Learning | Training Budget, Visited Conferences, Completed Certifications, Read Books, Metrics Utilization, Learning Time |
| Teaching | Held Team External Presentations, Team External Coachings |
Measurement of the Star Team Metrics
The use of metrics for measuring team performance can be very valuable in learning organisations, but they can be destructive in pathological bureaucratic organisations. The aim of the metrics should be focused on improvements of and by the team. These metrics are not necessarily suitable for measuring individual developers performance and we generally doubt the use of such metrics for measuring individual performance, for such goals one should prefer a personal interaction for developing individuals.
The aim of using team metrics is not to get a value stating how good a team is, but to identify and track areas for improvements.
As the DORA Metrics cover mainly speed and outcomes, they are alone not sufficient to assess and improve a development team. To measure the awesomeness of the Star Team, one should cover each of these Skills and ideally drill down into the individual categories. To make the model work best, it should be used in a communicative way by the team. Either the (quantitative) metrics could be reviewed regularly or the (qualitative) metrics could be assessed by the team in a workshop with discussions and subsequent prioritisation of improvement initiatives.
Our proposal is to combine quantitative metrics, like the DORA metrics, with qualitative assessment of the other skills. We are currently experimenting with both, using DORA Metrics and a qualitative survey with one question for each single of the categories with responses ranging from Strongly Disagree (=1) to Neither Agree nor Disagree (=3) to Strongly Agree (=5).
By tracking the individual categories of the Star Team Skills, one can get a better picture of potential improvements and in combination with suitable tools or best practices like in playboox, one can find the way to become an awesome team.
Would you like to learn more about the Star Team Skills and how to improve them using playboox? Just give us a note below.